If you have worked with earlier versions of Microsoft Dynamics NAV, you must have remember the Code Coverage. Code Coverage made developer’s life easier during that time.
However, suddenly Microsoft decided to remove code coverage from Dynamics NAV releases and which was kind of a heart breaking point for many C/AL developers.
Then Microsoft introduced a profiler to replace the Code Coverage. For me Profiller never reach to the level of Code Coverage and most of the time I felt the need of code coverage.
With 2016 version Microsoft has decided to relaunch the Code Coverage with new options.
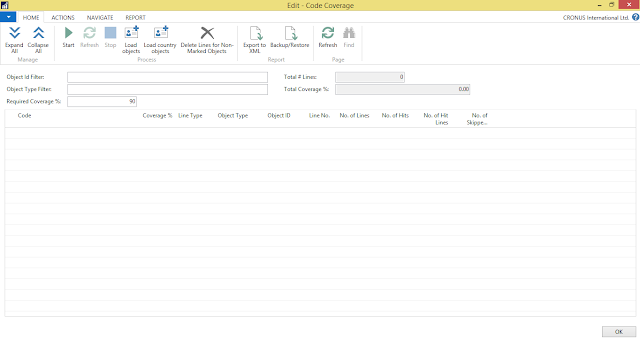
When you want to trace the code for a specific action just click on the start button and do your work in the Dynamics NAV and once you completed stop the code coverage.
It shows all the objects that has been accessed during the operation time. If you expand it will show how the code is been executed in the background. This will be really useful to identify the issues related to objects.
Code Coverage page list all the objects it got hit during the process and it will show the functions, triggers and coverage percentage.
Hope this will be helpful for you all in the future.
Please provide your feedback with a comment.
Thank you and Regards,
Tharanga Chandrasekara


1 comment
Good day,
Do you know whether Nav 2017 kept the code coverage tool or have they gotten rid of it again?
Thanks in advance!