Have you ever been in a partner or user situation where you have felt a little bit of slowness in the system while performing a task but never got enough info or ways to report it to your development team or the partner supporting the system?
Now there are a few ways to analyze the performance related to Business Central, and one of the easy and useful methods is through the “Analyze Performance Profiler”.
If a user is experiencing any slowness in the system, they should follow the steps below and send the details to their Business Central partner. With those details, the partner can investigate the issue much faster and more efficiently as the “Performance Profiler” records the call stack and how long each function took to complete its task. With this information, the partner will be able to identify the bottleneck that causes the slowness in the system.
While recording, the profiler monitors all the apps involved in the process. These include first-party apps from Microsoft, such as the Base Application and System Application, and any third-party apps you have installed.
To record, please use the below steps:
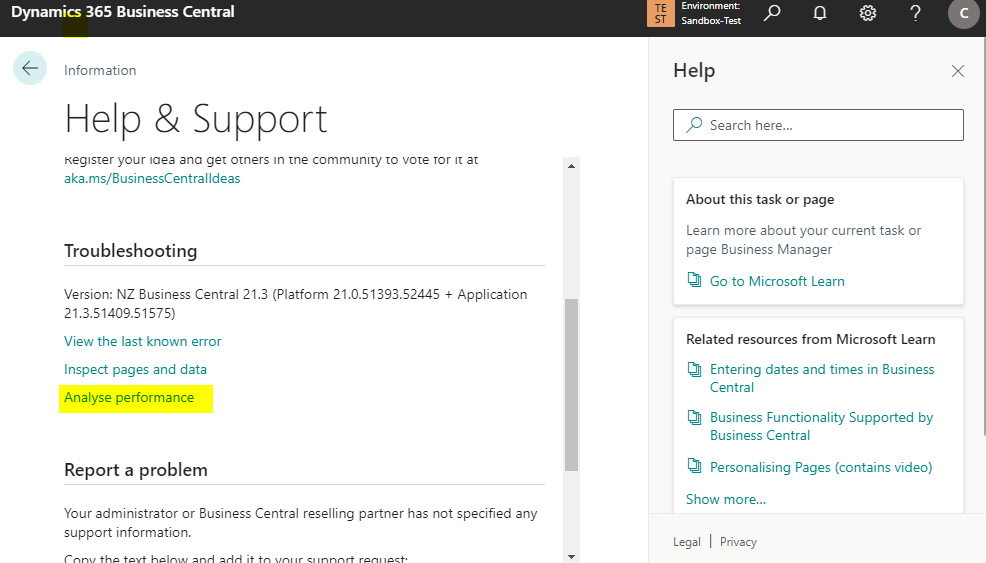
Step 01: Go to Help by clicking the “?” on the top right corner of the ribbon.
Step 02: Click on “Analyze Performance” under Troubleshooting.
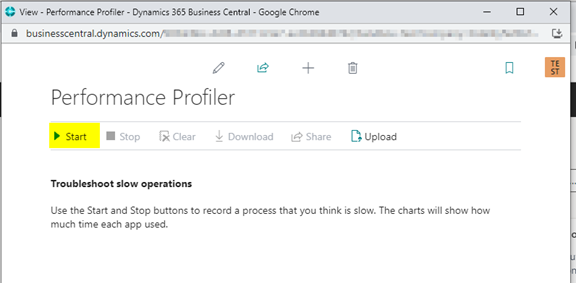
Step 03: Click “Start” on the Performance Profiler and keep it running in the background.
Step 04: Perform the activity that feels slow.
In the background, the “Performance Profiler” records all the function calls and execution details.
Step 05: Once the activity is completed, go back to “Performance Profiler” and click Stop.
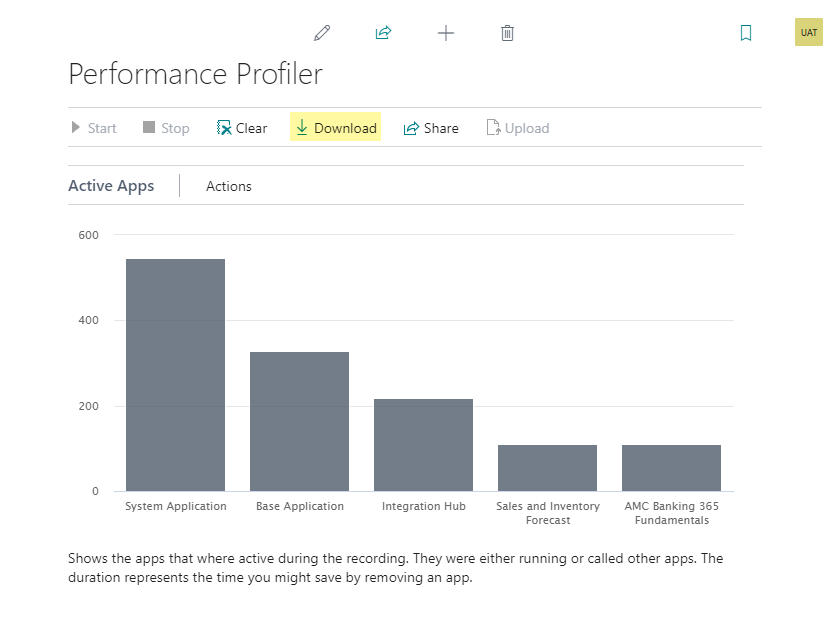
It would take a few seconds for the profiler to complete the information, and once it is complete, you will see something similar to the screenshot below.
After you record a snapshot, you’ll get two types of insights:
- The Active Apps chart shows how faster the process could be if you remove each app.
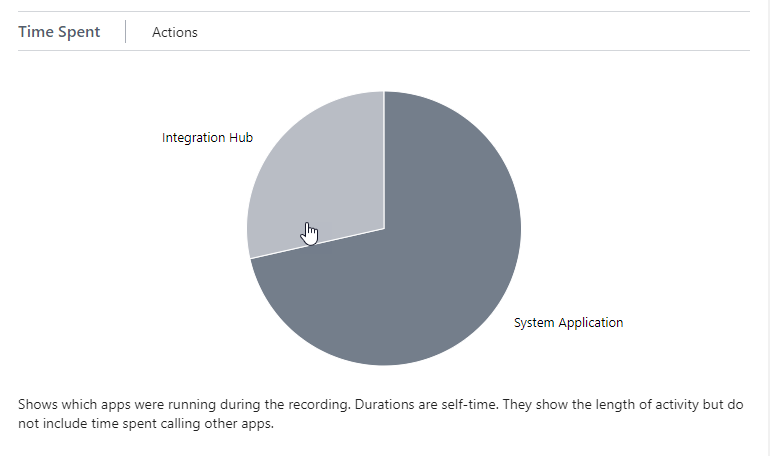
- The Time Spent chart shows how many milliseconds each app took to complete its part.
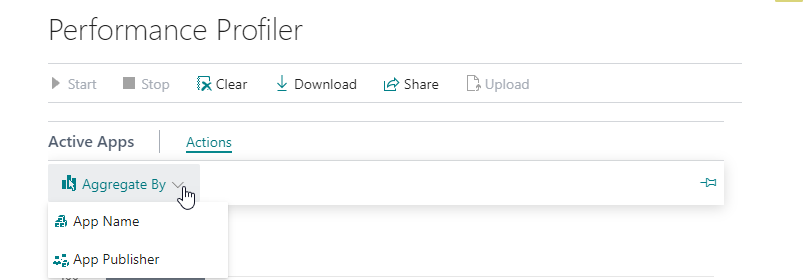
You can also aggregate apps by Publisher and by App Name by selecting Actions and then Aggregate By action.
To discover more on the technical side of things, you can toggle “Show technical information”

The Time Spent pane shows which apps were running during the recording of the process and the length of the activity per app (time spent calling other apps is not included)
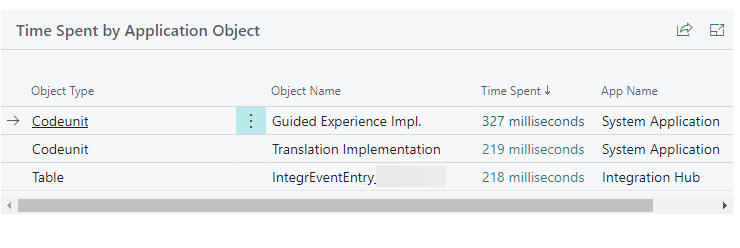
The “Time Spent by Application Object” pane shows the time spent on each object involved in the monitored process. We can sort by the “Time Spent” to understand which object takes more time to execute its logic.
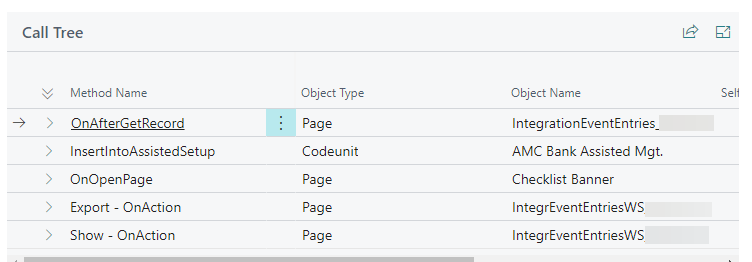
In the Call Tree pane, we can analyze the entire stack of calls for the recorded process
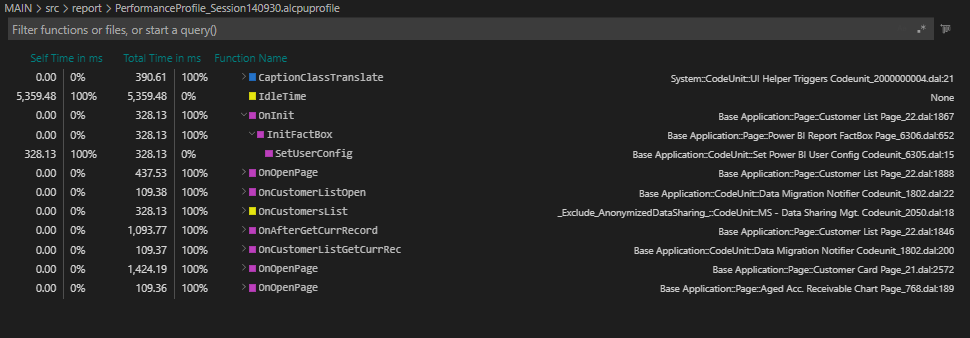
Let’s say you do not want to go into technical details and would rather let someone with technical knowledge handle that; then, you can download the recording and send it to the person who will analyse the performance bottleneck. Once you click download, it will download .alcpuprofile.

Then the person analyzing the performance impact can copy the file into VS Code and analyze it. Once open is VS Code, it will look like the below. They can even upload it to a “Performance Profiler” if they prefer a more graphical representation. The profiler respects GDPR rules, so no sensitive data are monitored or transmitted.
I hope you like it, and let me know your comments and thoughts.
Thank you and Regards,
Tharanga Chandrasekara
